Description
BCG Matrix Template Excel
The BCG Matrix Template, also known as the Boston Consulting Group BCG Growth Share Matrix Template, the BCG Model, BCG Chart or the Boston Consulting Group Diagram, is available for MS-Excel and MS-Word. The BCG matrix is widely used to perform business portfolio analysis as one of the steps in strategic planning process.
You get a FREE copy of our Strategic Planning Workbook with each copy of this Excel version of the BCG Matrix.
The BCG Growth-Share matrix maps the business units (or products) on the basis of (a) their relative market shares and (b) market growth rates using the two axis of the matrix.
By using the standard MS-Excel bubble chart format we have added a third dimension. The size of the individual bubbles show the relative market size.
The workbook can be easily modified and customised by anybody with basic Excel skills.
The BCG framework assumes that (a) an increase in relative market share will result in an increase in the generation of cash; (b) a growing market requires cash investment to respond to the market growth.
Using the Market Growth Rate and Relative Market Share axes the BCG matrix template plots a four-cell chart. The four cells are:
Cash cows are units with high market share in a slow-growing industry. These units typically generate cash in excess of the amount of cash needed to maintain the business. As the markets are mature new competitors do not enter and many of the weaker existing competitors withdraw from what they see as an unattractive market with little growth prospects. The “cash cows” tend to become dominant suppliers and get good cash returns with very little investment being required to maintain market share.
Dogs, refer to business units/products with low market share in a mature, slow-growing industry. These units typically are cash traps with money tied up in a business that has little future potential. They also tend to depress the overall return on assets. The disposal of Dogs can generate cash to invest in more attractive sectors.
Question marks tend to pose an investment dilemma in that they are potentially attractive in that because they are in a high growth market they have the possibility to be turned into “Stars”. Because of their high growth rate and the need to increase market share they typically require significant cash investment. Being high growth sectors they will frequently be very competitive and may already have some “Stars”. Question marks must be analyzed carefully in order to determine whether they are worth the investment required to grow market share.
Stars are business units/products with a high market share in a fast-growing sector. Market leadership generates significant cash, but considerable ongoing cash investment is required to maintain that market leadership. The hope is that “Stars” become the next “Cash Cows”. If market leadership is maintained, then as the market matures and growth slows down, the “Stars” become “Cash Cows” and generate significant cash and a high return on assets.
The overall objective of the analysis is to help executives to decide which of their business units/products to fund, and business units/products to dispose of. The result is a balanced portfolio of high growth and cash generating lower growth units/products with the appropriate risk and reward profile.
Check out the Excel Boston Consulting Group BCG Matrix Templates User Guide before purchasing!
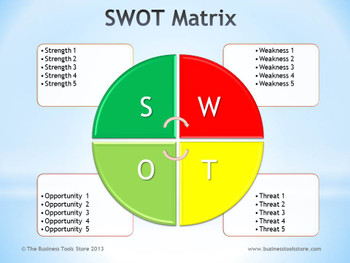
We also provide GE McKinsey Matrix templates which you can use to generate a GE McKinsey Matrix to depict the result of a business portfolio analysis. Our SWOT Matrix Templates can be used to generate the results of a SWOT analysis. Excel and Word templates for the Ansoff Product/Market Matrix are also available.
Order the individual MS-Word or Excel BCG matrix template that you require or alternatively order both templates and get 25% discount or order the package our Strategic Planning Package (includes SWOT, BCG and GE-McKinsey templates) and get up to 50% discount!
Other Similar Products
The Boston Consulting Group (BCG) Matrix template is also available for MS-Word.
We provide GE McKinsey Matrix templates which you can use to generate a GE McKinsey Matrix to depict the result of a business portfolio analysis.
Our SWOT Matrix Templates can be used to generate the results of a SWOT analysis.
A Word template for the Ansoff Product/Market Matrix is also available.
Our Strategic Planning Package (includes SWOT, BCG and GE-McKinsey templates) is available at up to 50% discount!
Need Something Different
If the features of the Excel The Boston Consulting Group (BCG) Matrix template is not exactly what you need please contact us and we will see if we can meet your needs.
No Quibble Money Back Guarantee
If you are not sure that our template is right for you, before purchasing, check out the Excel Boston Consulting Group BCG Matrix Templates User Guide before purchasing for full details of the comprehensive list of features and the ease-of-use that allows you to get started right away!
Still not sure, all our products come with a NO QUIBBLE 14-DAY MONEY BACK GUARANTEE
Security and Payment
The site is fully protected using the industry leading Geo-Trust SSL security system.
Payments via all major credit cards, Apple Pay and Google Pay are processed using Stripe payment processing and we also accept PayPal payments.
Once payment is processed, the items purchased can be downloaded immediately.


