MS-Excel Templates
SWOT Analysis Excel Template | SWOT Matrix Template Excel
- SKU:
- MW017E
- Availability:
- Downloadable immediately
Description
SWOT Analysis Excel Template
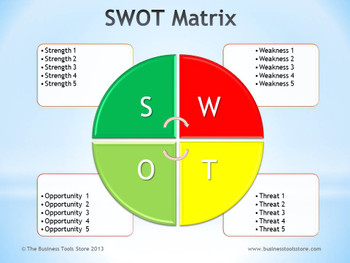
SWOT analysis is a powerful tool to use as part of the strategic planning process. It allows one to identify strategies that can be deployed to exploit Strengths while mitigating the potential negative impact of Weaknesses. Alternatively, strategies can be deployed that focus on maximizing Opportunities while guarding against Weaknesses.
For many the process starts with a strategy planning group SWOT brainstorming to generate a list of Strengths, Weaknesses, Opportunities and Threats. While this initial list is useful, there is a need to quantify the relative size and strategic importance of each SWOT component, i.e. how does Strength A compare to Strength B.
Our SWOT Analysis Matrix Excel Template allows you to quantify the results of a SWOT analysis across three dimensions and lets you to quickly produce a graphic representation using a MS-Excel bubble chart format. You can quantify (1) the relative size of the Strength or Weakness, etc. (2) its current relevant importance and (3) its longer term relative strategic impact.
A graphic representation of the results of a SWOT analysis facilitates the quick visual assimilation of the key features and highlights of the results.
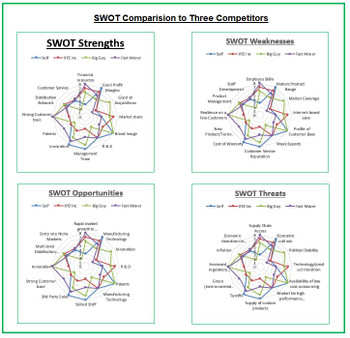
SWOT analysis is also a particularly useful tool to use to get an insight into your competitors and potential wining strategies. Our SWOT Competitor Analysis Radar Chart template allows you to do a SWOT comparison against up to three competitors.
You can get a package that combines the three SWOT Matrix templates for PowerPoint, Excel and Word at a discount of 30% on the individual prices.
SWOT or PEST Analysis?
PEST (Political, Economic, Social, Technology) analysis is another very useful tool to use as part of the strategic planning process.
From time-to-time there is a discussion on whether it is more appropriate to use SWOT, PEST or both.
SWOT focuses mainly on the enterprise in that it considers it strengths, etc. in looking at alternative strategic options.
However, enterprises operate within an overall external environment and very few have the ability to control or change that external environment.
Accordingly, they must take the external environment, e.g. economic outlook, technology evolution, etc., the constraints and opportunities it presents, into account. PEST analysis, focused on the Political, Economic, Social and Technical environment in which the enterprise operates is a very useful exercise to undertake prior to a SWOT analysis. It provides an excellent backdrop for the subsequent SWOT analysis.
Key Features: SWOT Matrix Excel Template
Key features of our Excel SWOT template are:
- Differentiates between SWOT features of different size. (X-axis)
- Shows the different immediate/current impact of each SWOT feature. (Y-axis)
- Displays the longer term strategic impact of different SWOT features. (Bubble size)
- The SWOT graphic format facilitates quick visual assimilation of key features and highlights of the results
- Available separately or packaged with PowerPoint SWOT and Word SWOT templates
- Available packaged with PEST templates
- Fully customizable within Excel
- Uses only standard Excel features, no macros
- Simple to setup – if you have Excel, you are ready to go!
- Outstanding customer service and support -- just check out what our customers say.
- Comes with a No Quibble Money Back Guarantee
- Comprehensive SWOT Analysis Templates User Guide is available to download to check the full details before purchasing!
Description/Methodology: SWOT Analysis Template Excel
By using the standard Excel bubble chart format, the SWOT template allows you to present the key results of a SWOT analysis as a graphic matrix in three dimensions.
The framework presented here allows the SWOT results to be plotted in a logical and meaningful way.
The X-Axis
Any SWOT internal factor, such as financial resources, management team or market reputation, is in itself neither a Strength nor a Weakness. The availability of substantial financial resources or a strong management team could be deemed to be a Strength while their absence could be deemed as a Weakness. From a graphic representation perspective, a Weakness is a negative Strength.
Similarly, an external factor can be an Opportunity or Threat to any individual organization depending on the organization’s ability to exploit it (an Opportunity) or to be negatively impacted by it. (a Threat)
Thus, this first axis (X-axis) measures the scale or magnitude of the SWOT factor. Each internal factor is identified as a Strength, or a Weakness and each external factor is defined as an Opportunity or Threat and the relative size is indicated on a scale of 1 to 9, 9 being a very large factor and a 1 being a relatively small factor.
Y-Axis
All Strengths or Weaknesses are not of equal relevance or immediate impact. The immediate, rather than strategic, relevance of, say, financial resources is clearly different in a business that requires significant working capital to one that is generating substantial positive cash flows.
Similarly, all threats or opportunities do not have the same current relevance or importance.
The second axis (Y-axis) is used to plot the short-term relevance of each SWOT factor. The relative importance or impact is indicated on a scale of 1 to 9, 9 being very significant impact and a 1 being very little impact.
Z-Axis
SWOT analysis is normally used as part of the strategic planning process. Within that context it is appropriate to consider the longer term strategic impact of the relevant SWOT factor on the organization. The Z-Axis (the diameter of the bubble in a bubble chart) is used to plot the longer term strategic, rather than immediate, relevance/importance and impact. The relative importance or impact is indicated on a scale of 1 to 9, 9 being very significant impact and a 1 being very little impact
Interpretation
Items plotted close to the (0,0) are the least significant, either because they are not rated as important or the relevance or impact is very low. Those that are at the extremes of the chart are the largest and are rated as highly relevant.
The size of the bubble indicates the strategic impact of the SWOT factor, the larger the bubble the greater the strategic impact.
SWOT Templates: Other Versions and Bundles
- Individual Word SWOT or PowerPoint SWOT matrix templates are also available or
- Alternatively order the combined Excel, PowerPoint and Word SWOT package and get 30% discount
- Our MS-Excel Competitor SWOT Chart template that allows you to do a competitive comparison of your own SWOT against up to three competitors.
- Check out our Strategic Planning Workbook
- We also provide General Electric GE McKinsey Matrix templates which you can use to generate a GE-McKinsey Matrix to depict the result of a business portfolio analysis.
- Our Boston Consulting Group (BCG) Growth Share Matrix Templates can be used to generate a BCG Growth-Share Matrix.
- Our Strategic Planning Templates Package (includes SWOT, BCG and GE-McKinsey templates) and get up to 50% discount!
- A PEST Analysis template is also available as a standalone item or packaged with the SWOT analysis template.
Need Something Different
If the features of the SWOT Excel template are not exactly what you need, please contact us and we will see if we can meet your needs.
No Quibble Guarantee
Comprehensive SWOT Analysis Templates User Guide is available to download to check the full details before purchasing!
If you are still not sure, all our products come with a NO QUIBBLE MONEY BACK GUARANTEE
Security and Payment
The site is fully protected using the industry leading Geo-Trust SSL system.
Payments via all major credit cards, Apple Pay and Google Pay are processed using Stripe payment processing and we also accept PayPal payments.
Once payment is processed, the items purchased can be downloaded immediately.


